If you thought the heading seemed loaded with caution, you are tracking with me. With real GDP growth in the U.S. expected to slow from 2% in 2023 to 0.9% in 2024, it is reasonable for investors to feel nervous. Add in the fact that ~70% of U.S. GDP is attributable to consumer spending, and it is easy to discount entire industries from investment simply out of fear. Historically, as a recession starts to bite, investors have typically avoided Retail, Travel & Leisure, Construction, Automotive and Financial Services, while Health Care, Utilities, Consumer Staples, and Telecommunications were seen as less affected by recessions.
Weekly Sector Review
For the week ended Sep 8, 2023
Why I am actually (somewhat) buying into (parts of) Analyst forecasts
Published on 09/11/2023
This time might be different™
We’ve had months to figure this out
This might be the slowest recession train to ever arrive at the station, and it is not certain at this point when it is going to get here. In July 2020, a Reuters poll of economists put the probability of recession in the U.S. at 25%. By October 2022, the probability had climbed to 66% in favour of a recession, which is where the New York Fed’s website placed the probability of recession at time of writing.
Analysts have had almost two years to forecast this event, and they have been aided by management teams equipped with more real-time data on operations than in the history of the world. Add to this the comparatively new ways to gauge real-time consumer intentions and sentiment by way of social media and I argue that we can look to consensus forecasts at the top of the Income Statement for some meaningful direction this time. I go to the top of the income statement because revenue is arguably the least treacherous of financial metrics that are broadly calculated.
Of the more than 2,000 companies I review, I have selected approximately 1,100 for which I believe the consensus revenue forecasts are worth aggregating. Analytically, I don’t use forecasts for companies unless they are covered by at least seven analyst, and unless there are at least seven years of EBITDA from which valuation can be established.
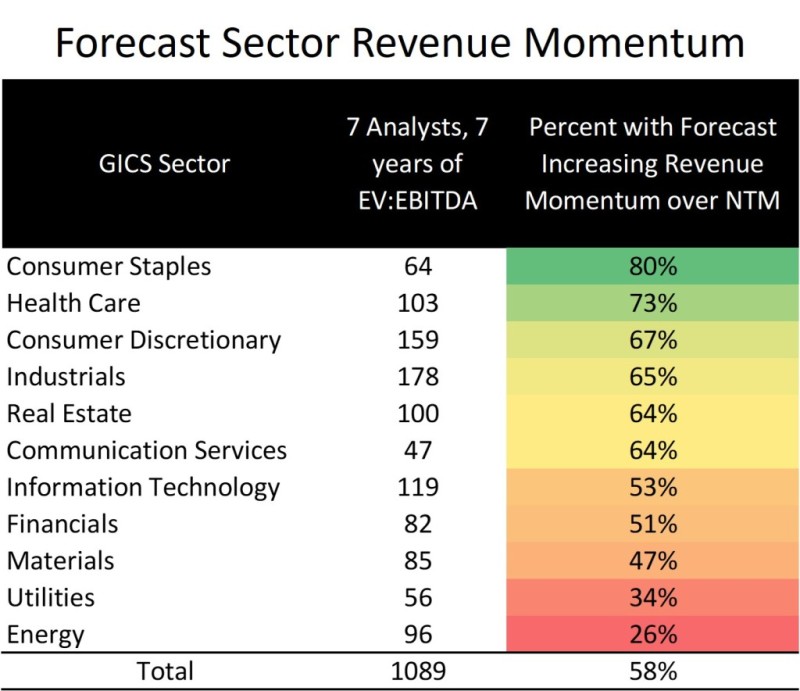
The chart highlights forecast revenue momentum by sector. To learn how I calculate momentum, click here (less than 2-minute excerpt). Consumer Staples and Health Care are right at the top, which is consistent with traditional defensive thinking, but positions three and four are taken by Consumer Discretionary and Industrials, two sectors that include Retail, Travel & Leisure, Construction and Automotive (among others). At the bottom of the chart we find Energy and, perhaps surprisingly, Utilities. This isn’t your grandpa’s recession.
Going one level down, to Industry Group, we now have 24 entities (I have left out banks because they operate differently than other companies in our analysis).
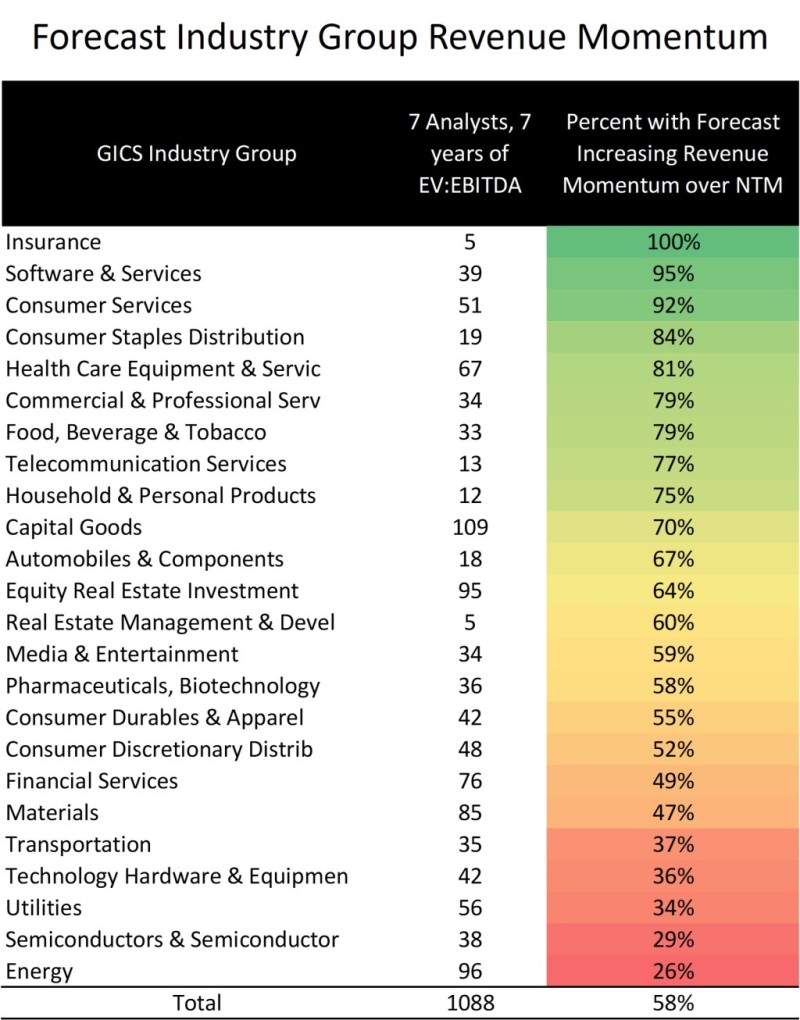
When I use data in these charts, I am looking for signal strength. I want the number of companies being examined to be large, but I want the percentage of companies presenting momentum to be either very large or moderately small. You may be surprised why I like looking at smaller percentages. Take Energy, for example: only 26% of 96 companies (25 in total) present attractive revenue momentum. Twenty-five companies are forecast to produce revenue growth and 71 are not. Combining this chart with that of the Weekly (directly below) provides me with an opportunity to buy relatively attractive Energy companies at fire-sale prices.
Weekly sector recap
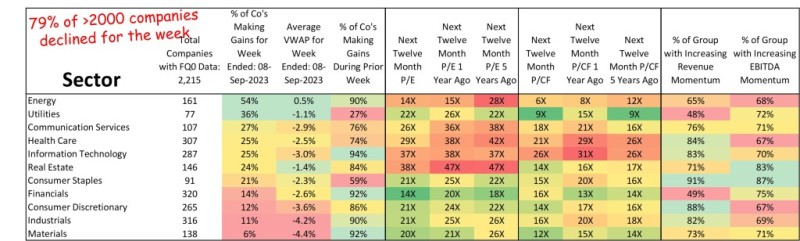
Last week, 79% of the more than 2,000 companies I follow posted declines, and this was broadly distributed across 10 of 11 sectors. Across most sectors, less than 25% of constituents participated to the upside. Energy was the only sector that squeaked out a gain, and more than 50% of its constituents moved higher.
Experienced Portfolio Manager, Board Director & Strategic Advisor
I’m a CFA charter holder and discretionary portfolio manager with over 15 years of experience in investment research and more than a decade serving on boards. I work best where integrity, insight, and long-term thinking matter.
In addition to portfolio management, I hold licenses to trade financial derivatives and offer life insurance solutions—allowing me to provide holistic, tax-aware guidance across a broad spectrum of client needs.
Disclaimer: The material contained herein is for information purposes only. This material is not intended to be relied upon as a forecast, research or investment advice, and is not to be construed as an offer or solicitation for the sale or purchase of securities, or as a recommendation for you to engage in any transaction involving Designed Wealth Management Inc. Investors should carefully consider the risks of investing in light of their investment objectives, risk tolerance and financial circumstances.